Introducing my new, early-morning-before-the-kids-wake-up, AI-assisted project:
In June 2025, I came across the story of the Zebra30 project. ZUG (Zentrum fir Urban Gerechtegkeet) had crowdsourced information about dangerous crossings in the city — and when the city refused to share its own analysis on crossing compliance, ZUG took them to court. After nearly four years of legal proceedings, they won, and turned that hard-won data access into a map letting residents see how they’re affected — giving them the power to pressure the administration into fixing things. The win mattered on multiple levels: it’s how many people first heard about ZUG (myself included), and it exposed just how far public data access still has to go. It may also have paved the way for broader access, establishing that: “A database that describes ‘a factual situation at a specific moment in time’ is public”(see here).
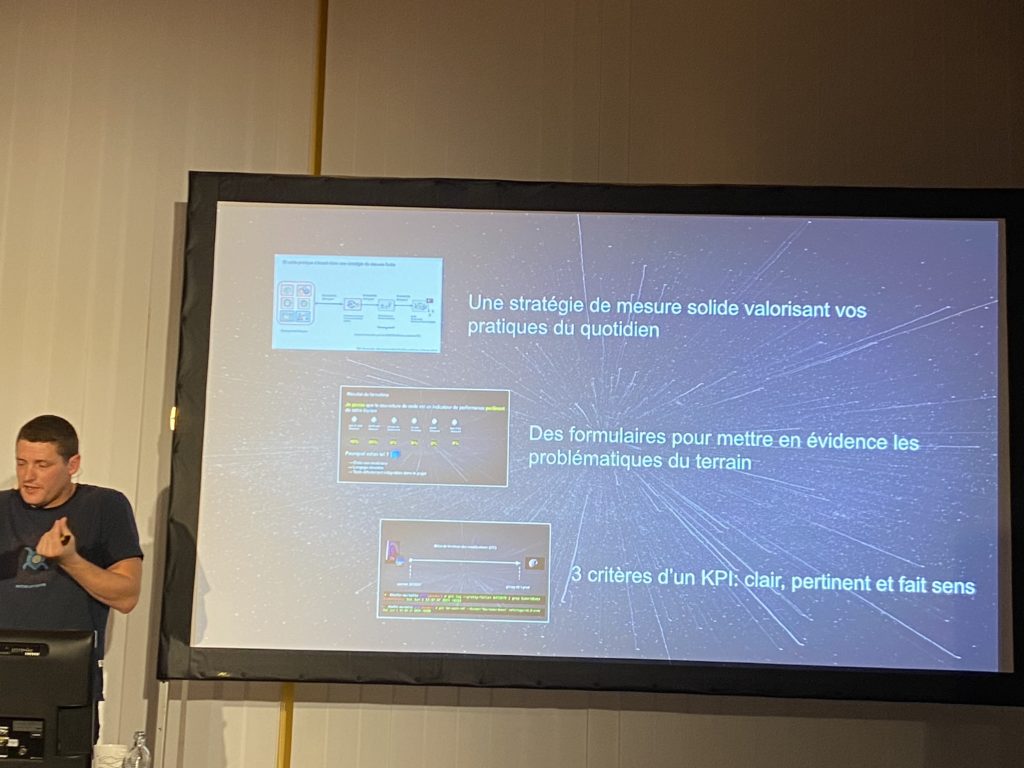
Around the same time, I “attended” the SciNoj #1 virtual conference and was struck by Heather Moore-Farley’s session on “The Impact of Lane Reductions”. She showed how detailed, accurate public data — specifically, California crash data — analyzed and visualized with Clojure could help a community drive real change and improve safety. After 23 years of building software professionally, and all the talk about how “software is eating the world,” the belief that software could genuinely change things for the better — the very idea that had drawn me into this field — had somehow quietly faded. This talk, and the energy of the conference in general, rekindled that original spark.
What I felt the Zebra30 map was missing was traffic context: a way to measure the real consequences of current conditions, to show how risky each area truly is. A dangerous crossing in a quiet, remote corner of the city is arguably less urgent than one right next to a known accident hotspot. I wanted to add that layer — so I started looking for data on the geographical distribution of accidents across Luxembourg.
Luxembourg has an open data policy (mandated by the Law of 14 September 2018), and several administrations do publish data for open access. Yet I couldn’t find detailed, historically accurate accident location data. There’s simply no public view of where accidents happen across the Grand Duchy.
And yet… this data does exist. Accidents are traffic events, and traffic events are reported in real time by multiple sources in Luxembourg: acl.lu, cita.lu, rtl.lu/mobiliteit/trafic. What’s missing is the memory of these events — specifically, when and where they happened. Someone needs to record that; someone just needs to remember. And memory is everything: LLMs, if nothing else, have made abundantly clear over the past few years just how essential full context is to correctly planning the next step.
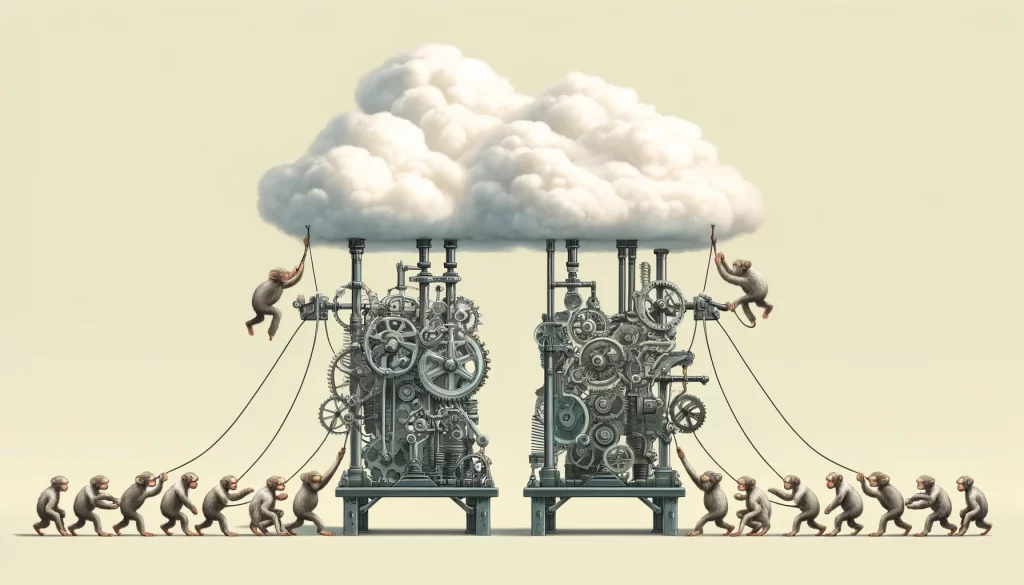
But transforming live, real-time events into context — assembling that memory — used to take money, skill, and serious effort. At least, that used to be the case.
“The Cloud” has spent the last decade driving down the cost and technical barrier to running persistent services and storing large amounts of data. Between GitHub Actions (thousands of free minutes) and Google Cloud Storage (tens of GB for a few cents), cost is no longer a barrier. And complexity? You used to need a machine somewhere, Linux skills, the whole deal. Now most of it is a few clicks or a few lines of YAML.
The resources are there. The serverless platforms are ready. The storage is waiting. But you still needed to write the code, test it, and know how to handle every layer of a working solution: back-end, front-end, operations, design, security. Even if you were comfortable with some of it, chances are you dreaded the rest — or simply weren’t good at it.
Enter Claude Code, Codex, Cursor, and friends. They don’t dread any of it — if anything, they’re a little too eager, sometimes reaching for things they shouldn’t touch. They’re not perfect at everything, but if you don’t rush, don’t try to do it all in one go, and force them to stay within guardrails — steering them with your real-world experience of what actually works (and what doesn’t), which is now the main missing ingredient — they’ll help you build all the pieces of a working solution.
The emphasis has shifted slightly: less about raw energy, skill, and curiosity; more about clear vision, experience with the full software development cycle, and a method adapted to these new tools. Not that the first set no longer matters — it’s just increasingly offset by what the tools can do. And there’s a useful side effect of carefully managing context and history for your code assistant: you can always pick up right where you left off, whenever you have a spare hour. That’s ideal when your project only gets early mornings.
Where things stand (early March 2026):
- I’ve been collecting accident data since July 2025 — so I’m finally starting to have enough to spot some trends.
- I have a first clean version of the visualization map, with the ZUG data layered in for context.
There are still bugs, some that I know:
- Translation errors in the interface
- Selection issues that vary depending on screen size and zoom level
- … and I’m sure plenty I don’t …
What’s next:
- Continue updating the data monthly
- Experiment with different visualisations (maybe highlighting road segments?)
- Improve data consolidation so that nearby markers on the same road don’t cluster awkwardly
- Improve positioning at intersections, to more accurately indicate which road is affected
Further evolution (my current ideas – others are welcomed!):
- Could Wee.lu use historic Meteolux weather datasets to show how rainy days compare to dry ones? Or to see if certain roads are more accident-prone under specific conditions — snow, for instance?
- Maybe add some ways to select specific time frames for the visualisations: periods, night/day selection.
Of course, all of this means more early mornings — so I can’t really say when any of these ideas will actually make it onto the site.
An early conclusion:
It seems that now the present can become actionable memory—community memory, community tools: the dream of Eric S Raymond of the citizen programmer is closer than ever. Will this dream transform our communities and make our lives better, fairer, happier? Or are we going to drown in AI slop? I cast my vote with the first— while admittedly risking to do the second…
What do you think? Take a look at Wee.lu and let me know in the comments.